Good news, everyone! We’ve found a way to get useful information about attempts on Numbas tests out of Blackboard, and present it like this:
The current situation at Newcastle is that all of our in-course Numbas tests which count towards credit are run through a Moodle server set up specifically for the purpose, even though our institutional VLE is Blackboard.
The reason for that boils down to the fact that Blackboard doesn’t make it easy to analyse data to do with SCORM packages: the built-in SCORM reports don’t give much useful information and are tedious to generate, and it’s unclear where in the database the SCORM data lies. If a student claims that their answer was marked incorrectly, we have no way of checking it because Blackboard only gives you the student’s reponse to an interaction, and not the expected response. And sometimes that’s not enough: it’s much easier to work out where a student’s gone wrong if you can load up the test as they saw it. SCORM has a review mode which does that, and while I was able to add support for that to the open-source Moodle server, Blackboard is a black box and brooks no intervention.
Can you work out where this student went wrong?
So, for the past few years, we’ve avoided Blackboard ourselves and other Numbas users have come up with all sorts of work-arounds, sometimes even asking students to take screenshots of their exam summary screens, to get round the fact that Blackboard doesn’t give you the information you need.
Last week, we discovered that the Export/Archive Course tool collects together all of the attempt data for SCORM packages in a way that can be easily interpreted. You get a .zip file containing full copies of all of the SCORM packages, as well as XML files containing all the attempt data and other stuff to do with the course. That’s great! However, XML isn’t an easy format to read at the best of times, and the archive file’s byzantine structure makes it hard to even find the file you want to look at.
So I’ve spent a couple of days putting together a tool which takes in Blackboard course archives, and presents you with a nice web interface to browse through the data it contains. It’s designed to work with Numbas tests – it might work with other SCORM packages, but we don’t guarantee it.
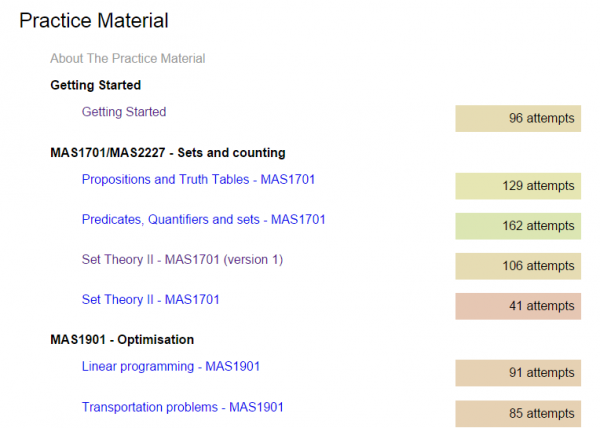
The tool’s course index view.
Once you’ve exported a course archive from Blackboard and uploaded it to the analysis tool, you’re shown the course structure. You can see how many attempts there have been at each SCORM pakcage, and you can click through to see a more detailed report listing each attempt.
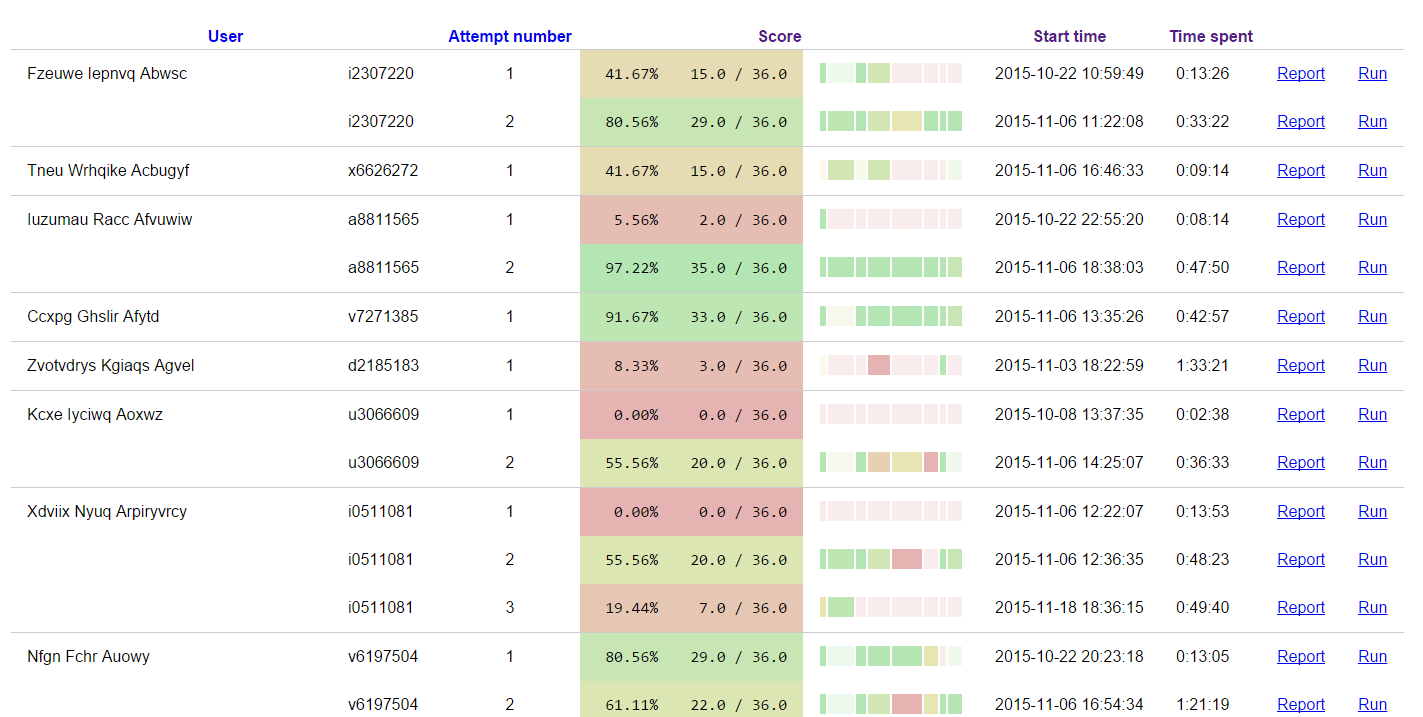
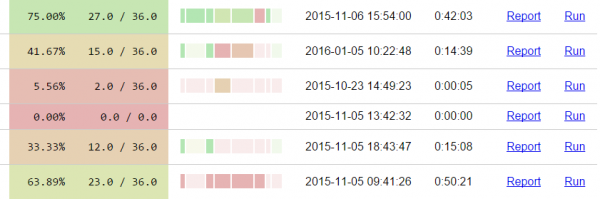
A report on a typical SCORM package (identifying information removed)
The attempt listing shows you how well each student did, with a simple colour coding so you can pick out high and low scores. There’s also a question-by-question breakdown, so you can see where each student went wrong. It also makes it easy to pick out inconsistent data – as we and many other Numbas users have found, Blackboard occasionally overwrites some of the data to do with an attempt, leading to the scores not tallying up correctly, or a student apparently completing a test in a couple of seconds.
From this page, you can click on the “Run” button to open the test in review mode – you’ll see the test exactly as the student saw it, starting at the exam summary page.
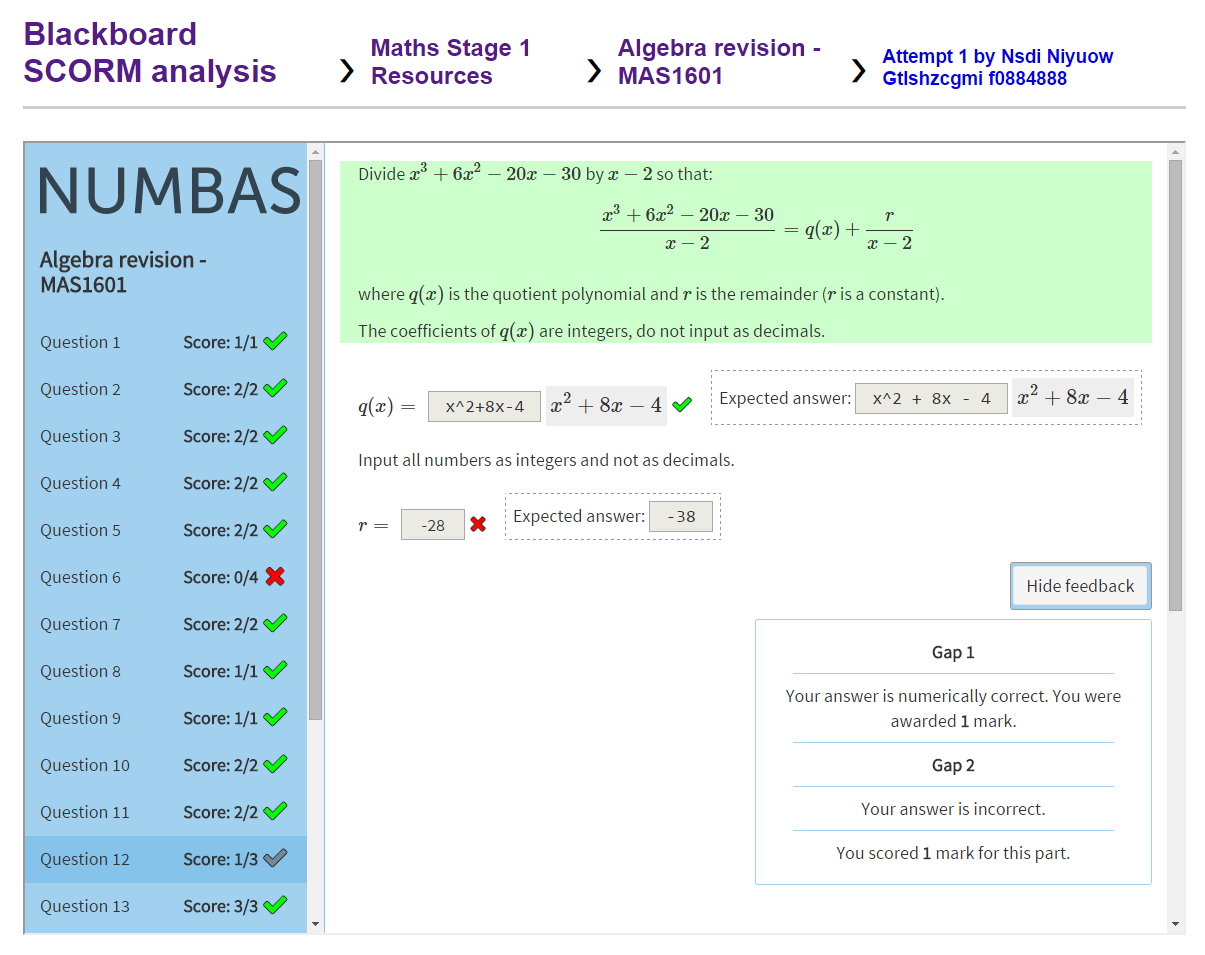
Reviewing an attempt allows you to see exactly where a student went wrong.
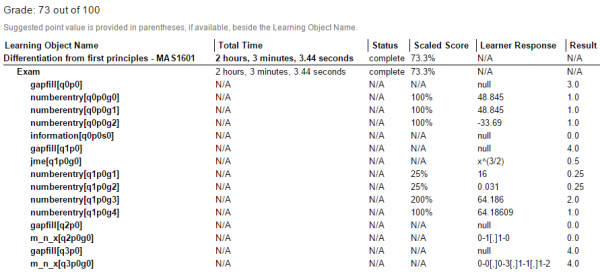
Finally, the Report link shows a detailed breakdown of the attempt, with information on each part, as well as the values of variables for each question and a copy of the session’s suspend data, for when you need to do some serious debugging.
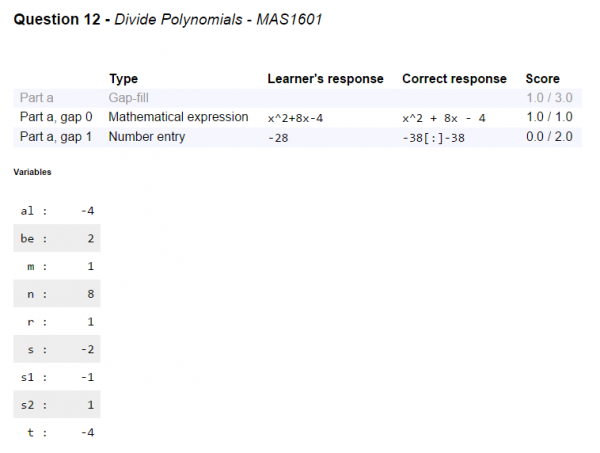
Breakdown of a question, including the values of the question variables.
This tool comes at just the right time for us – as part of our reworked maths degree curriculum, we decided to put a large bank of practice questions on Blackboard, where students are more likely to see them. Because they’re just for formative use we didn’t mind too much about not being able to guarantee reported scores are correct, but we had no way of knowing how effective the material had been. Now, we can see exactly how many attempts the students made, and how well they engaged with the material – did they try each question, or did they just load the test once and leave immediately? This information will be a huge help to guide our development priorities in the future.
Now that we’ve got the basics of interpreting and presenting the data sorted out, we’re going to work on adding more visualisations of the data, such as plots showing when attempts were started over time, and CSV exports of data to go into our centralised e-learning support systems.
You can download our Blackboard SCORM analysis tool from GitHub. It’ll run on your desktop computer – all you need to install is Python 3 and a couple of open-source packages.