In this series of posts, we’re highlighting questions we’ve found on the public Numbas editor which do something innovative or are of particularly high quality.
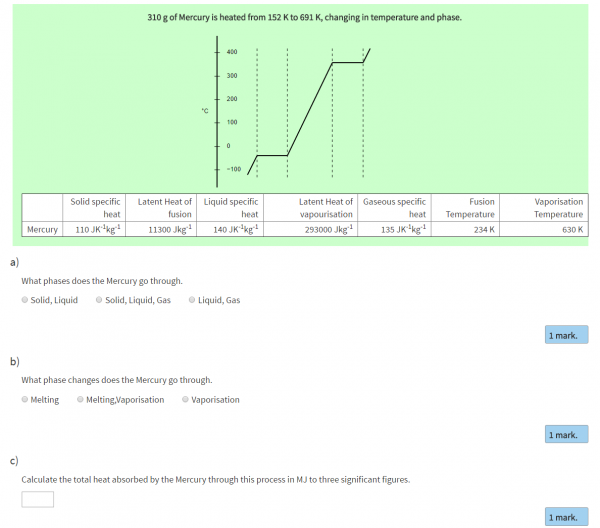
This question by Dr. Tom Stallard of the University of Leicester asks students to interpret a graph showing the temperature of a material as it is heated. The graph is dynamically generated using the JSXGraph extension, and a table shows some of the physical properties of the material.
While quite a simple question pedagogically, I like how the dynamic graph in this question displays information to the student in an intuitive format.
We asked Tom how he uses Numbas in his teaching:
I am an Associate Professor of Planetary Astronomy at Leicester. I use Numbas for the College of Science and Engineering Foundation Year, teaching the module Heat and Energy. I use Numbas both as a teaching aid, providing randomised questions at the end of each lecture that the students can use to practice with as the course continues, as well as a form of continuous assessment, with a set of randomised questions every two weeks that the students can re-take to a passing grade. Because the students use these questions extensively, I make sure to include a broader range of randomisation, so that not only the specific numbers, but the aims and content of the questions can change each time the question is asked.
Thanks to Tom for releasing this question under a CC-BY licence, so others can reuse this question freely!
Try this question now, on the Numbas editor, or have a look at the rest of Tom’s freely-available content.